
Place Standard
Trends and Analysis
| Theme | 2016 | 2025 |
|---|---|---|
| Moving Around | 3.6 | 3.7 |
| Public Transport | 3.6 | 3.5 |
| Traffic & Parking | 4.3 | 4.6 |
| Streets & Spaces | 4.7 | 4.8 |
| Natural Space | 5.6 | 5.4 |
| Play & Recreation | 4.7 | 4.7 |
| Facilities & Amenities | 4.4 | 4.4 |
| Work & Local Economy | 4.0 | 4.2 |
| Housing & Community | 4.0 | 3.8 |
| Social Interaction | 4.2 | 4.7 |
| Identifying & Belonging | 5.0 | 5.1 |
| Feeling Safe | 5.8 | 5.4 |
| Care & Maintenance | 4.8 | 4.8 |
| Influence & Sense of Control | 3.9 | 4.4 |
| Nature & Land Management | 4.9 |
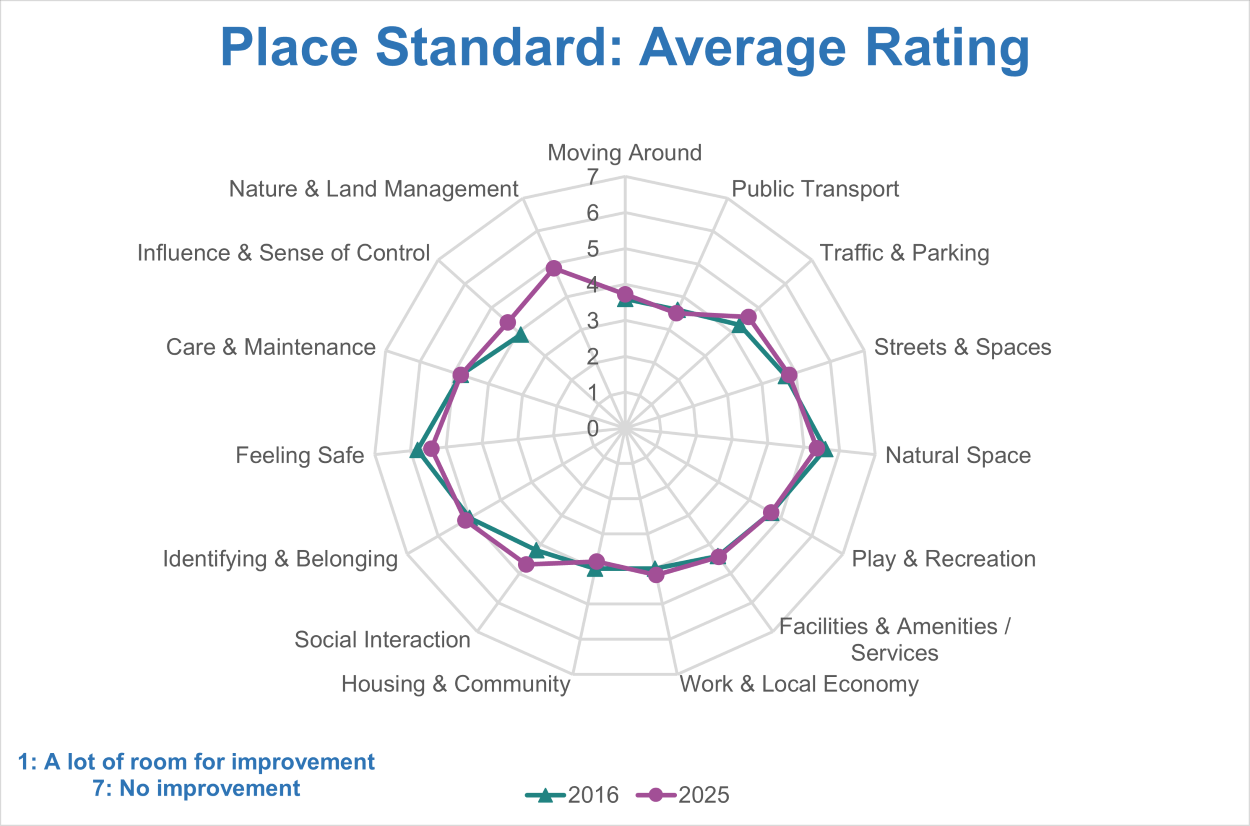
The above graph and table shows the average score given for each of the 14 themes addressed in the Place Standard, for all respondents from Shetland. The closer a score is to 1, the more improvement respondents feel is needed.
There was a slight increase in scores between 2016 and 2025 for Work and Local Economy. There were slight decreases in the scores for Public Transport, Natural Space, and Housing & Community. Of particular note for the 2025 Place Standard is the change in the age demographics of respondents, with 49% of respondents being under 18. In contrast, in 2016, 8% of respondents were aged under 24.
Last updated: May 2026