
People in Shetland who feel part of their community
Trends and Analysis
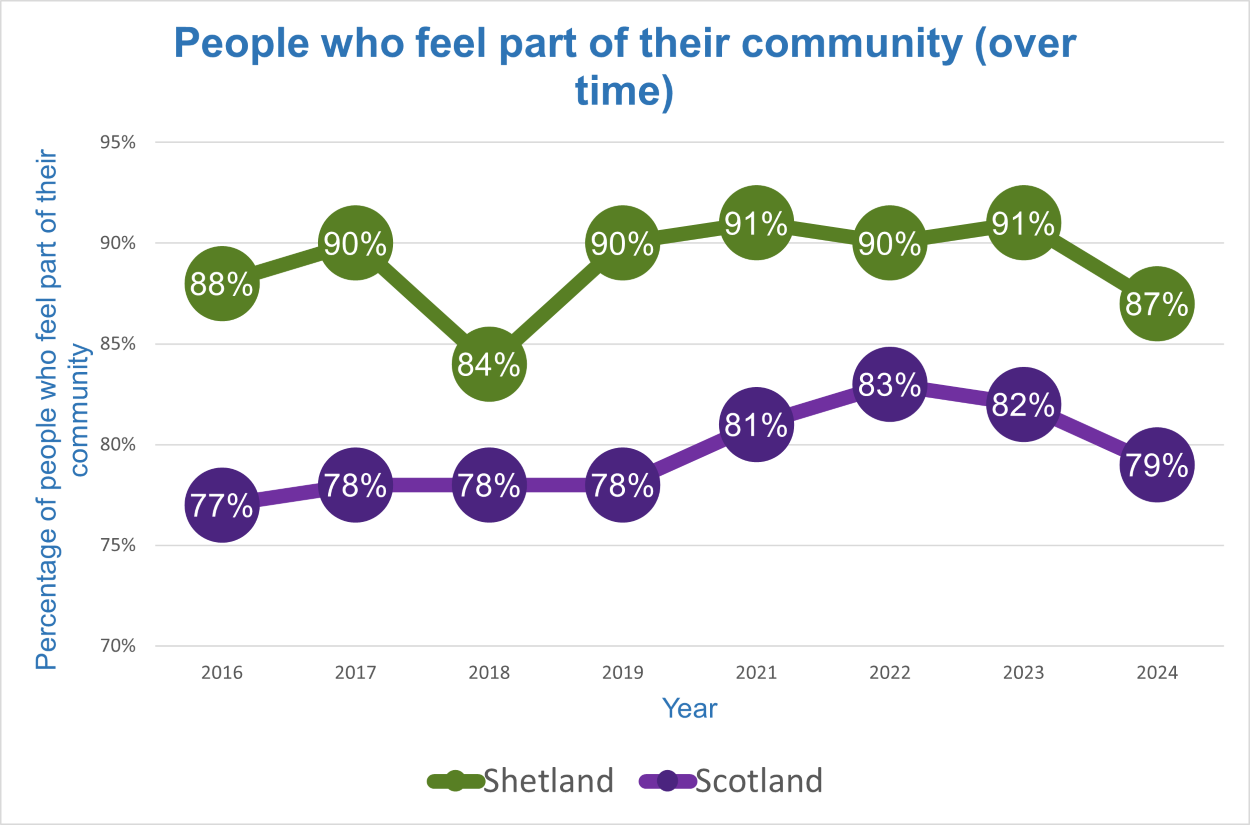
| Year | 2016 | 2017 | 2018 | 2019 | 2021 | 2022 | 2023 | 2024 |
|---|---|---|---|---|---|---|---|---|
| Percentage Shetland | 88% | 90% | 84% | 90% | 91% | 90% | 91% | 87% |
| Percentage Scotland | 77% | 78% | 78% | 78% | 81% | 83% | 82% | 79% |
The above graph and table shows that between 2016 and 2024, Shetland has experienced a higher percentage of people who feel part of their community than Scotland as a whole each year. There has been no substantial change in these figures since local monitoring began in 2016.
For 2021, the results are published as experimental statistics as this was done via telephone rather than face to face like prior years.
Last updated: May 2026