
Carbon Emissions
Trends and Analysis
There are two ways to look at carbon emissions from the DESNZ dataset: carbon emissions in the Council area or carbon emissions directly impacted by the Council in the area. Emissions that local authorities do not have direct influence over includes LULUCF (land use, land use change and forestry/agriculture). This is the difference in the per capita emissions between the two. Both of these data sets from DESNZ are shown below.
Carbon Dioxide (CO2) Emissions Estimates 2015-2023 (t* CO2e**)
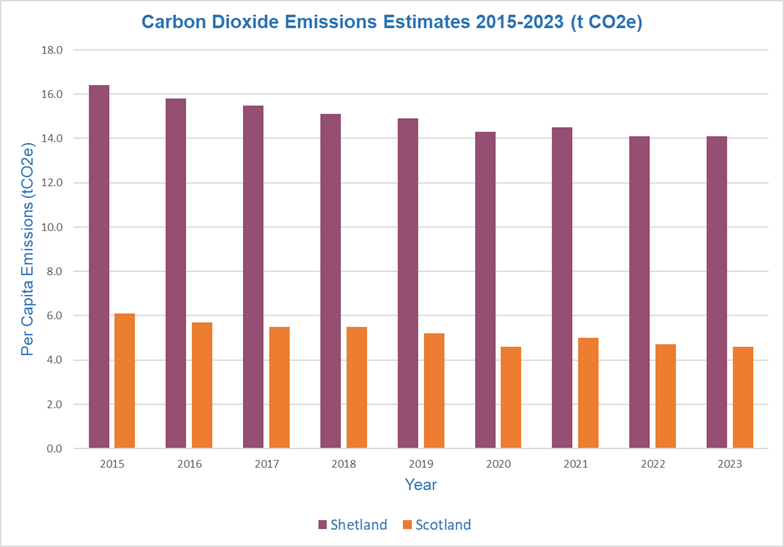
| Year | Shetland Per Capita Emissions (tCO2e) | Scotland Per Capita Emissions (tCO2e) |
|---|---|---|
| 2015 | 16.3 | 6.1 |
| 2016 | 15.7 | 5.7 |
| 2017 | 15.4 | 5.5 |
| 2018 | 15.2 | 5.5 |
| 2019 | 14.9 | 5.3 |
| 2020 | 14.2 | 4.6 |
| 2021 | 14.5 | 5.0 |
| 2022 | 14.4 | 4.8 |
| 2023 | 14.1 | 4.0 |
*tonnes
**CO2e is carbon dioxide equivalent – which is a measure of all greenhouse gas emissions including carbon dioxide, methane, nitrous oxide and f gases. The data measured here is only carbon emissions. Carbon dioxide emissions is a metric measure used to compare emissions from various greenhouse gases based on its global warming potential (GWP) so that total greenhouse gas emissions can be reported on a consistent basis (the equivalent amount of CO2).
Carbon Dioxide Emissions Estimates within the Scope of Influence of Local Authorities 2015-2023 (t CO2e)
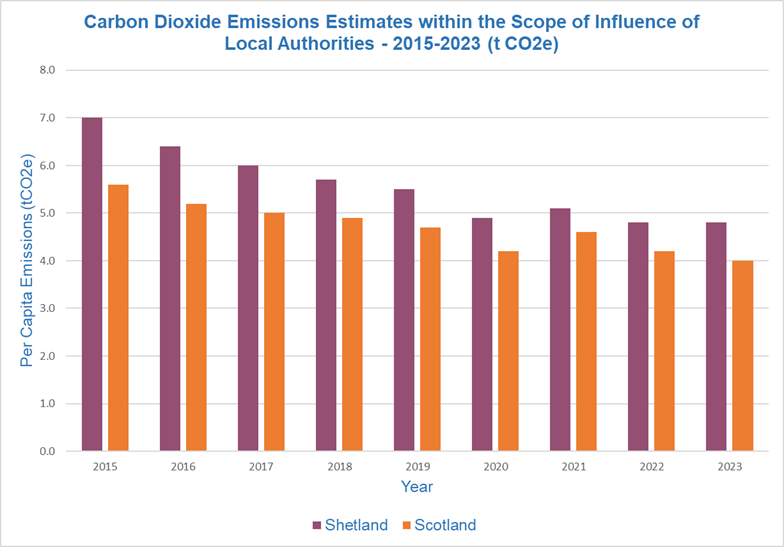
| Year | Shetland Per Capita Emissions (tCO2e) | Scotland Per Capita Emissions (tCO2e) |
|---|---|---|
| 2015 | 6.9 | 5.5 |
| 2016 | 6.3 | 5.2 |
| 2017 | 6.0 | 5.0 |
| 2018 | 5.8 | 4.9 |
| 2019 | 5.5 | 4.6 |
| 2020 | 4.8 | 4.1 |
| 2021 | 5.1 | 4.5 |
| 2022 | 5.1 | 4.3 |
| 2023 | 5.1 | 4.0 |
The DESNZ data for carbon dioxide emissions estimates in Shetland’s Council area shows that carbon emissions are stabalising.
Shetland's carbon emissions in the Council area, are still significantly higher than Scotland’s but the gap is narrowing. Carbon emissions directly impacted by the Council in the area are still higher than Scotland’s but not to the same extent.
Shetland's emissions per capita are significantly higher than Scotland’s average due to the remote location, population distribution, economy and geology.
Shetland Island Council’s Climate Change Strategy team have completed Net Zero Route Maps for both Shetland Islands Council and Shetland Islands as a whole. The Shetland Route Map enhances the national datasets with local specific data, giving a more accurate picture of emissions across Shetland. The Shetland Climate Change Steering Group, formed under the Shetland Partnership to build on the Shetland Net Zero Route Map learnings, has been working to create a place-based climate change strategy and action plan for Shetland. The Steering Group ran workshops, based on the key themes of: Buildings, Transport, Business and Industry, Waster and Resources, and Land. Outputs from these workshops will be used to determine the policy baseline.
The strategy is currently being signed off by partner organisations.
Last updated: May 2026