Annual Report 2024/25 - Locality Plan: Monitoring our Progress
Monitoring our Progress
The Locality Plan outlines a number of ways in which the performance of partners against the Plan’s objectives are measured. These include monitoring population levels and balance, income levels, the number and nature of jobs, volunteering levels, and community morale. Many of these indicators align closely with those being monitored in the Shetland Partnership Plan; however, there are some challenges with gathering and analysing data at a small community level.
This year the data for some of the Benchmarking Indicators is being gathered through work with island representatives. This data will be published with the Island profiles, in line with the publication schedule for the Locality Profiles.
The community survey, first implemented in 2020/21, was repeated in July / August 2025. These statistics should be interpreted with caution due to sample size, varying sample sizes across the islands, and presenting combined statistics for all five islands.
The response rate to the survey was lower than in previous years at 48 responses from across the 5 islands, a decrease from the high of 87 responses in 2024. Despite being markedly lower than 2024, the number of responses against the population of the islands is deemed acceptable for the results of the survey to be published. The findings are outlined below.
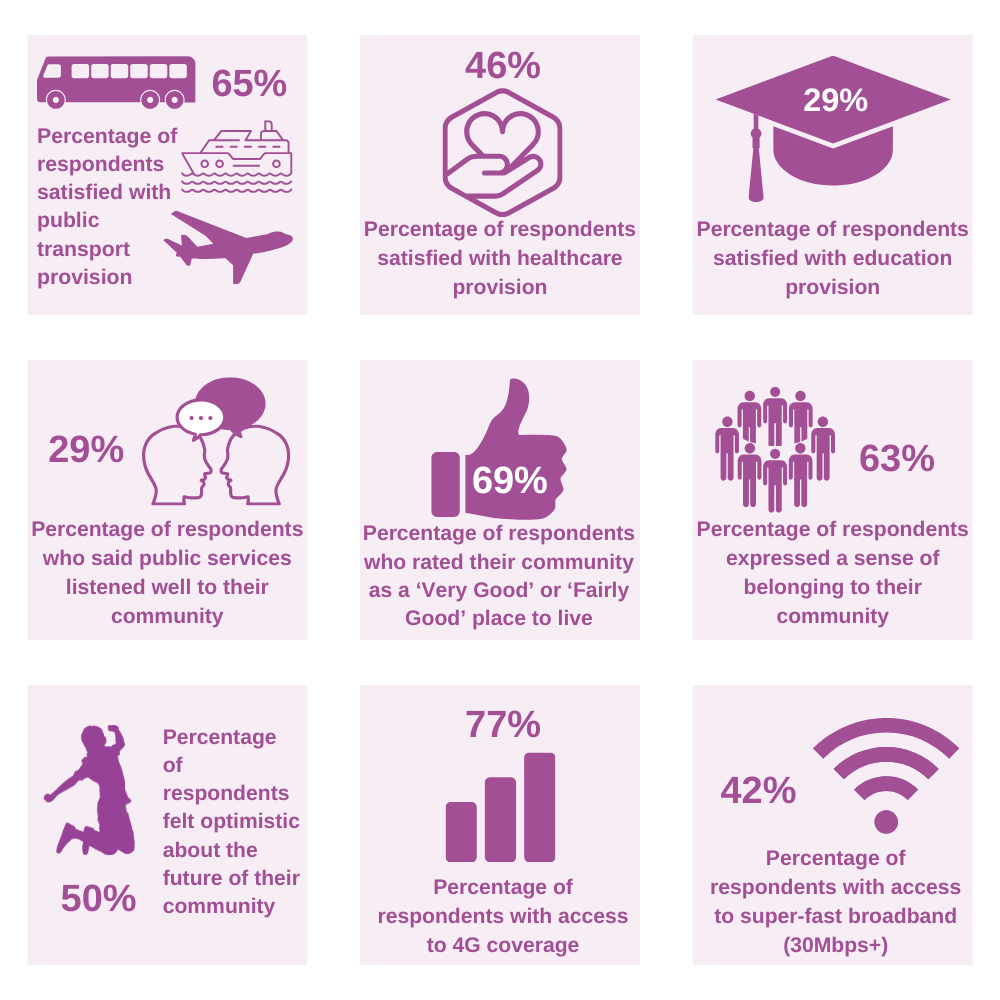
The survey opened with a question asking people how they rate their place to live; 69% of respondents rate their community as a ‘Very Good’ or ‘Fairly Good’ place to live, this is an increase from 63% in 2024, but still lower than the high of 74% in 2023.
In 2025, 63% of respondents expressed a sense of belonging to their community; a decrease from 71% in 2024 and the lowest level since 2021, when it stood as the 68%.
The percentage of respondents who feel optimistic about the future of their community has increased to 50%, from 43% in 2024. Though it is lower than 2023 (57%) and 2021 (51%).
When asked how they felt about the statement ‘Service providers listen well to my community when it comes to issues affecting us’, 29% of respondents either ‘Agreed’ or ‘Strongly Agreed’. This is a 1% decrease from 2024, the same as 2023 and 1% higher than in 2021.
Respondents were asked to rate their satisfaction with public services:
- 46% of respondents are ‘Very Satisfied’ or ‘Fairly Satisfied’ with healthcare provision, a 4% decrease from 2024, but higher than in 2021 (40%);
- 29% of respondents are ‘Very Satisfied’ or ‘Fairly Satisfied’ with education provision, a 2% decrease since 2023 and a 28% decrease from 2021;
- 65% of respondents are ‘Very Satisfied’ or ‘Fairly Satisfied’ with public transport provision, a 12% increase since 2024, and slightly lower than 68% in 2023.
The survey closed with questions related to connectivity:
- 77% of respondents reported that they have access to 4G coverage, an increase on the 72% reported in 2021, 2023 and 2024;
- 42% of respondents reported that they have access to super-fast broadband (30Mbps+), a 2% increase since 2024 and a 40% increase from 2021;
- When asked to rate current broadband, 56% of respondents rate their current broadband service as ‘Very Adequate’ or ‘Adequate’, a decrease from 2024 (73%), whilst 42% rate it as ‘Inadequate’ or ‘Very inadequate’, an increase from 2024 (21%).
In summary, a number of indicators measured by the survey have declined since 2024, whilst most increases do not surpass 2023 figures. Indicators for super-fast broadband and 4G coverage have increased year on year since 2021.